This is a simplistic trial with Finite Element Analysis modelling.
For a material which is otherwise steel with Elastic Modulus of 210GPa, the Poisson's Ratio has been varied from 0.0 to 0.49 (0.5 cannot be solved).
The object is the top of the Beam-Configuration Fillet-Weld Tensile Test (BCFWTT), which has the test weld. Seen in its physical form with steel beam and weld; the BCFWTT
.
I met an issue; the one-and-only pointless Finite Element Analysis
modelling exercise it is possible (as can be visualised so far) to
find
That takes special skill, because FEA models can point to answers for
things you have seen but never expected to know why, which you forgot
about years before.
With linear-elastic FEA, for identical geometries of BCFWTT, and leaving other variables like load applied unchanged, if you solve for
the second simulation done is pointless, because the Elastic Modulus of aluminium is taken as exactly 1/3rd of that of steel. Which means every deflection of the aluminium version will be exactly 3X that of the "steel" simulation.If the first BCFWTT simulation done were for steel; all deflections predicted by a FEA simulation for aluminium could be obtained by multiplying steel deflections by 3X (no new FEA simulation needed).
That can be totally foreseen.
Regardless of this : the value of one simulation is enormous.
For the initial
steel
simulation,
modelling as exactly as possible the
physical BCFWTT with steel beam and weld
,
the FEA model exactly predicted where the physical test sample breaks
on overload. That not being in agreement with current theory in
textbooks on fillet weld strength in transverse loading.
See that page in full, and others in the
structures
series, if interested in the entire topic.
In a linear-elastic Finite Element Analysis model, there are two differences between steel and aluminium
Poisson's Ratio
[Wikipedia]
has not been mentioned in detail yet, and should have been.
The effect of changing Poisson's Ratio is hard to predict.
Except : my private bet in this case is, with thinner walled
structures, the state of stress is essential "plane-stress". Not
"plane-strain", which can only be developed in big "chunky" objects.
My guess, guided by theory as I know it, is that when in a state of
plane-stress (were that correct), what the Poisson's Ratio of the
material is has little effect on the stress distribution in the
structure.
What comes next is the evidence; the basis to examine what really happens.
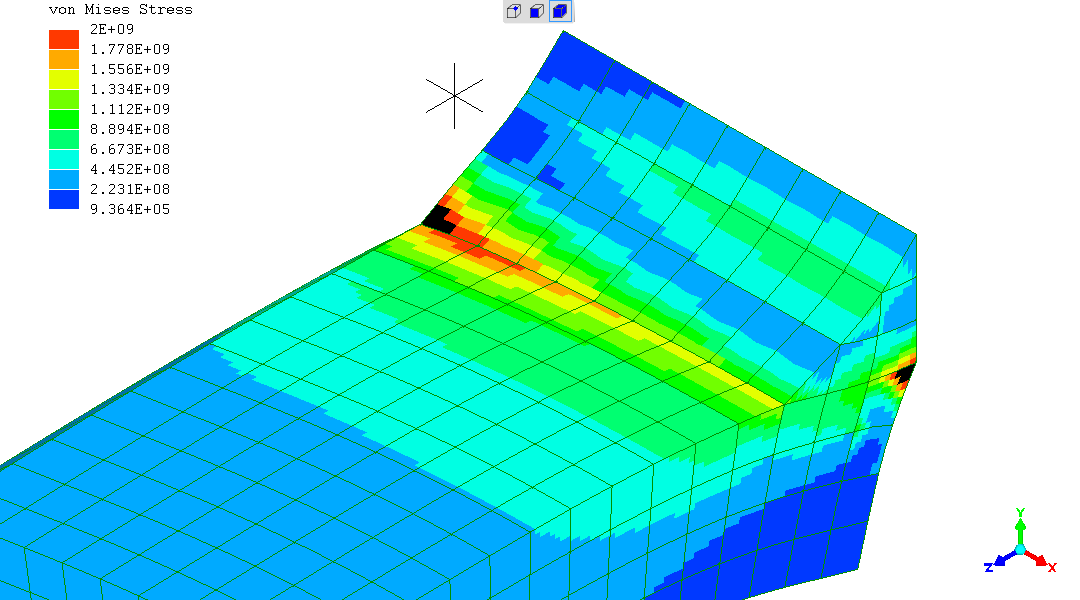
In all these displayed FEA outcomes, the deflection is exaggerated 40X.
Note the stress displayed has a scale maximum of 2GPa. Any higher
stress shows as a region of black colour. In the simulations for
steel
and
aluminium
,
the stresses displayed have a scale maximum of 1GPa.
The reason for the different choice is the different purpose. The
simulations of the BCFWTT, for steel and aluminium, have engineering
purpose.
This simulation series is an investigation, so extreme values are of
interest.
Poisson's Ratio = 0.0
Poisson's Ratio = 0.1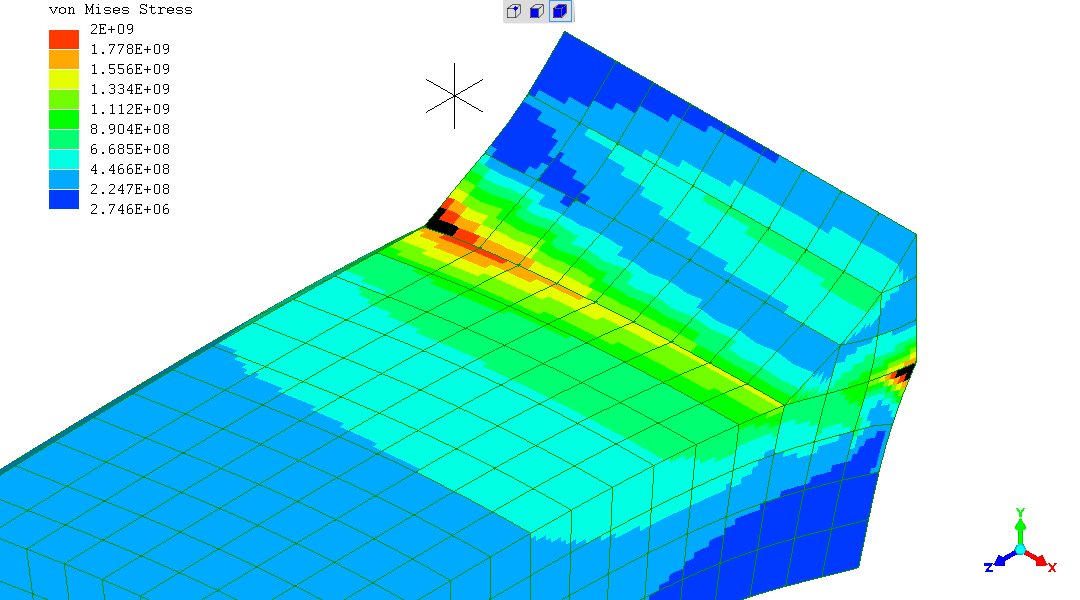
Poisson's Ratio = 0.2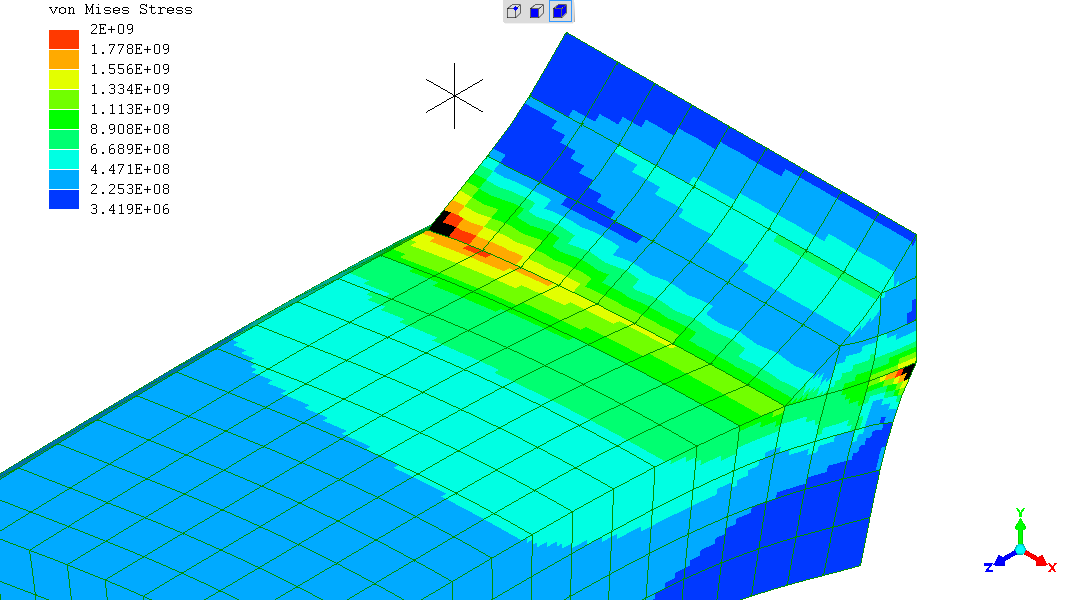
Poisson's Ratio = 0.3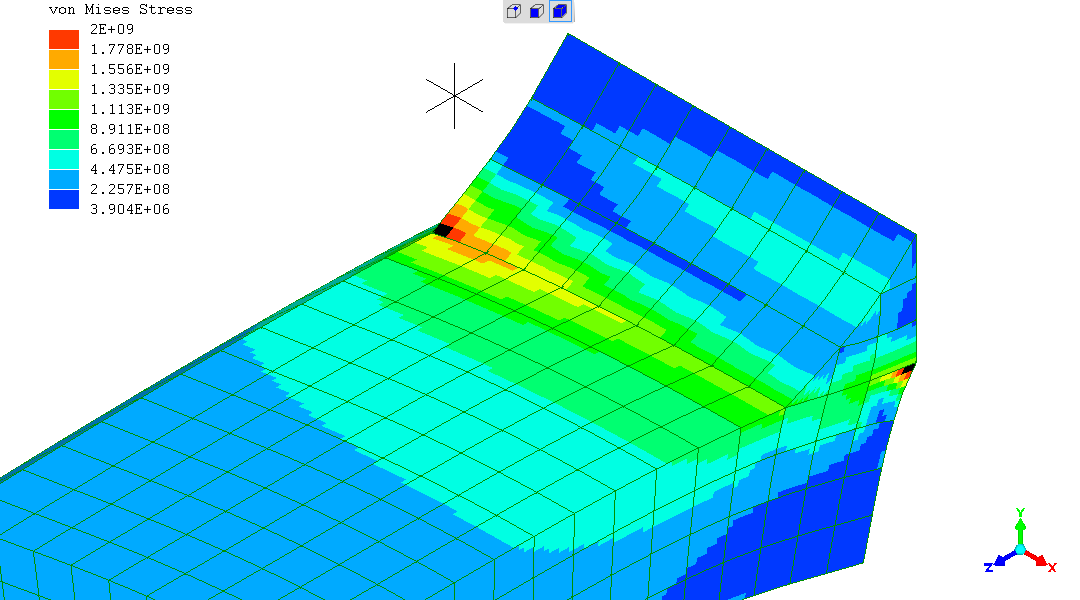
Poisson's Ratio = 0.4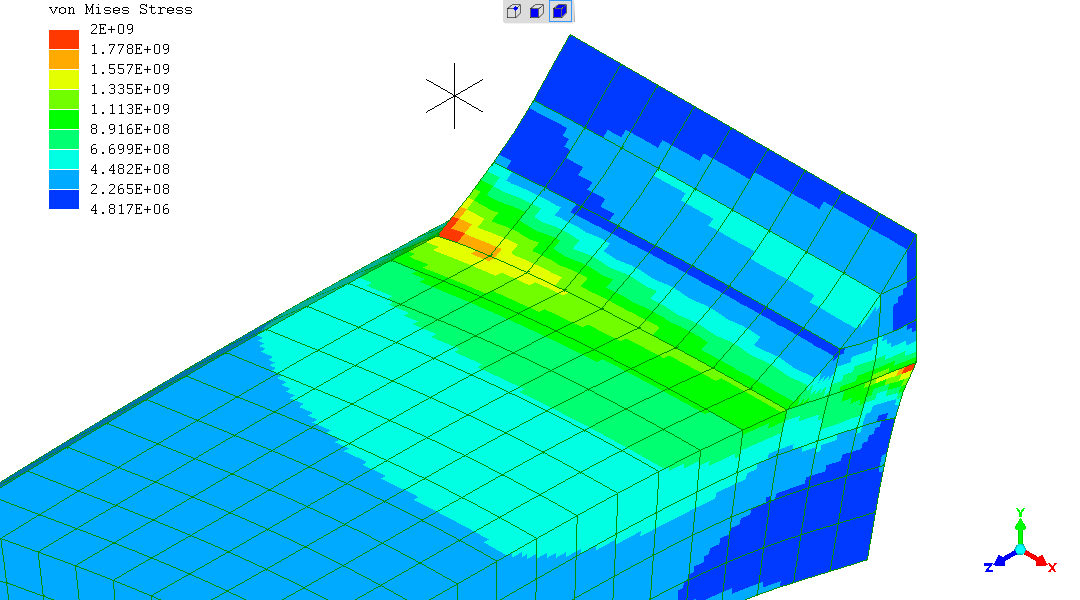
Poisson's Ratio = 0.45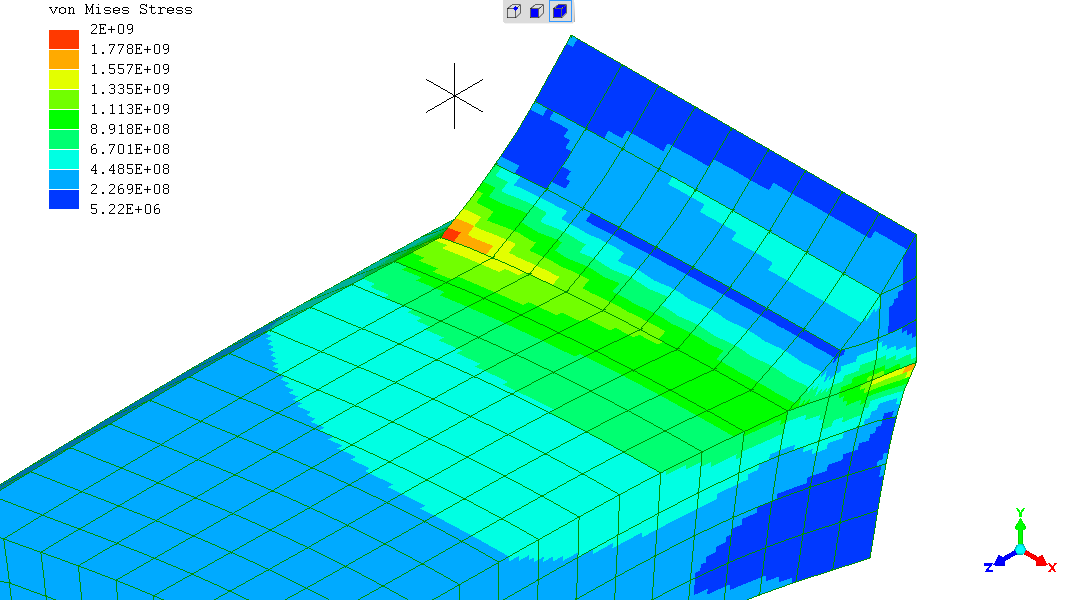
Poisson's Ratio = 0.48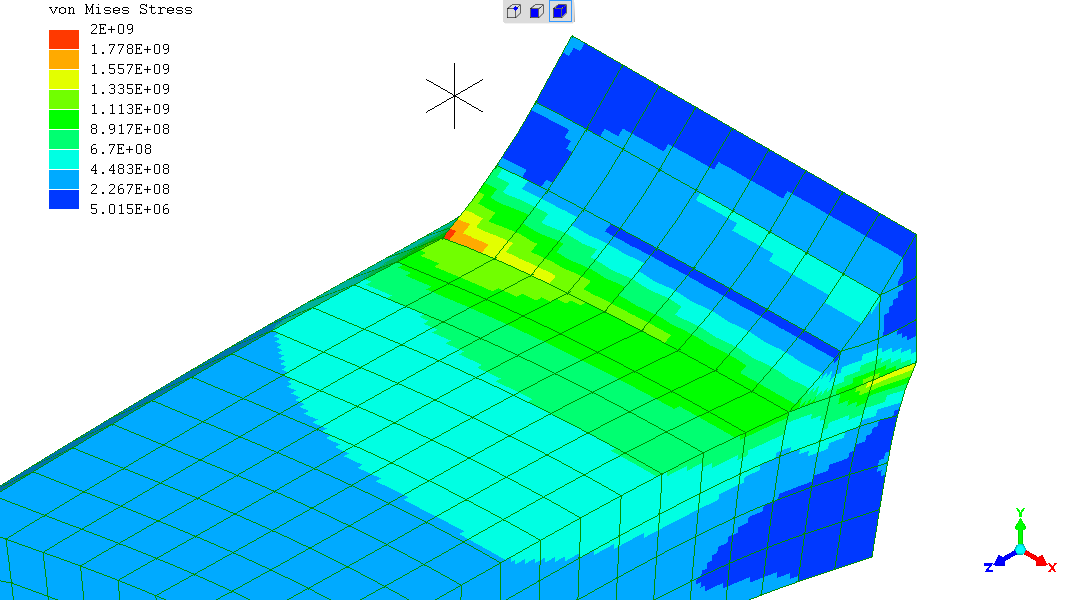
Poisson's Ratio = 0.49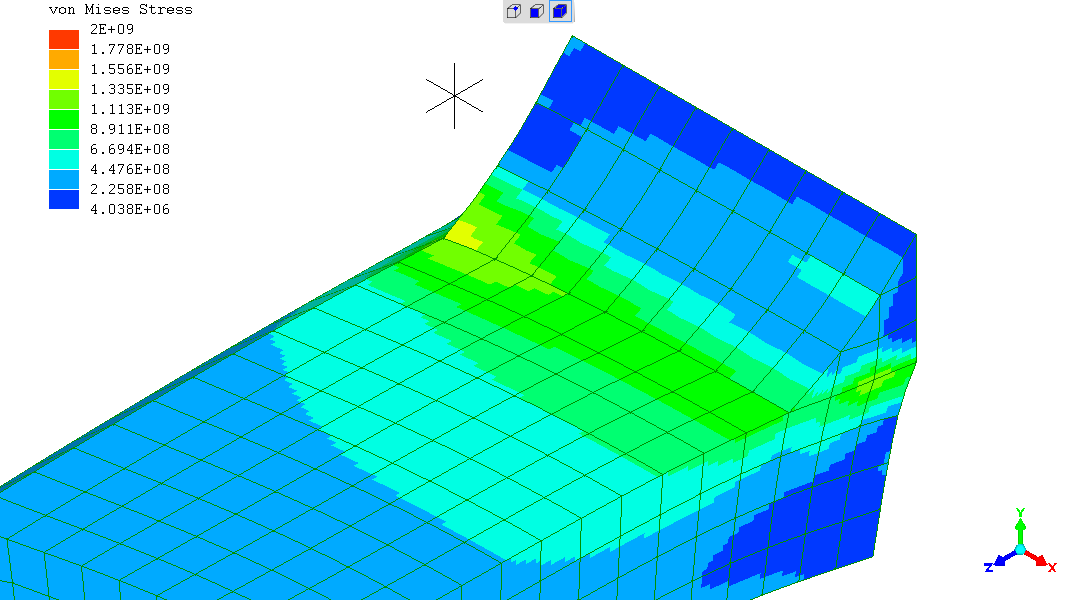
All with displacements exaggerated 40X.
Poisson's Ratio = 0.0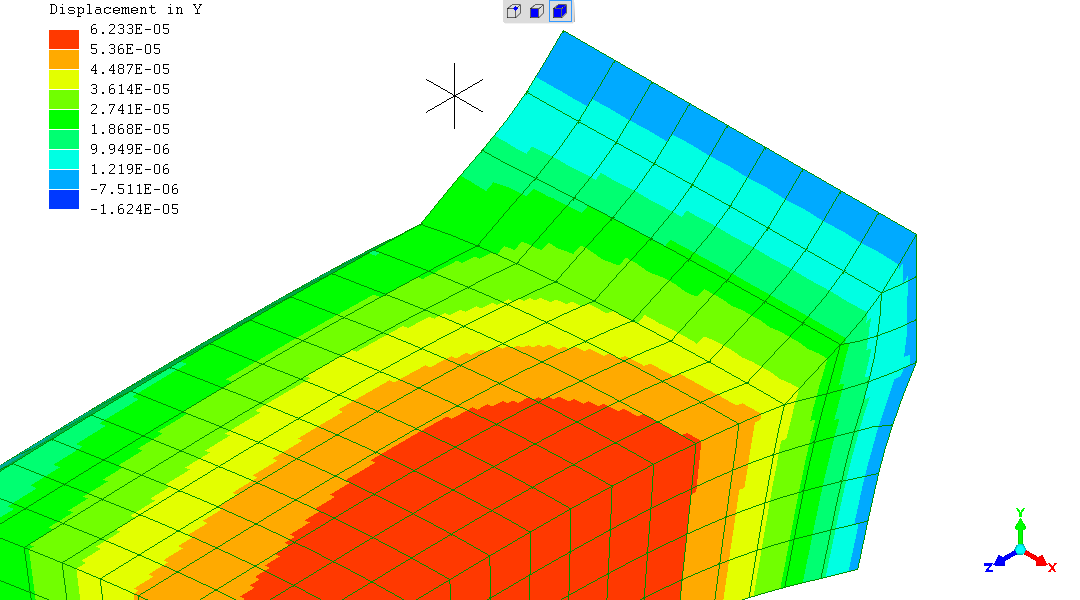
Poisson's Ratio = 0.1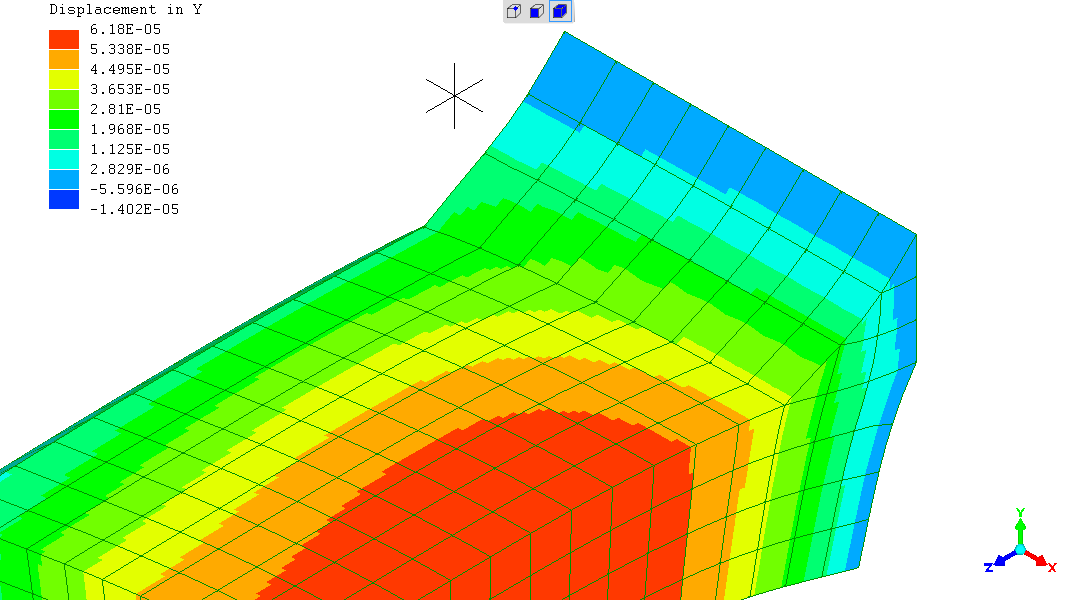
Poisson's Ratio = 0.2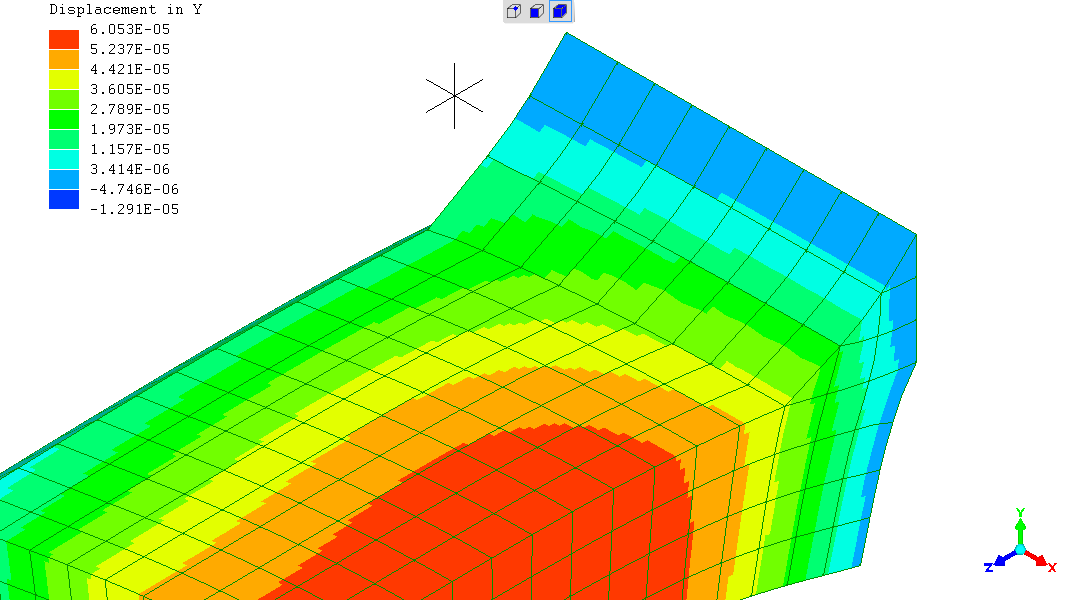
Poisson's Ratio = 0.3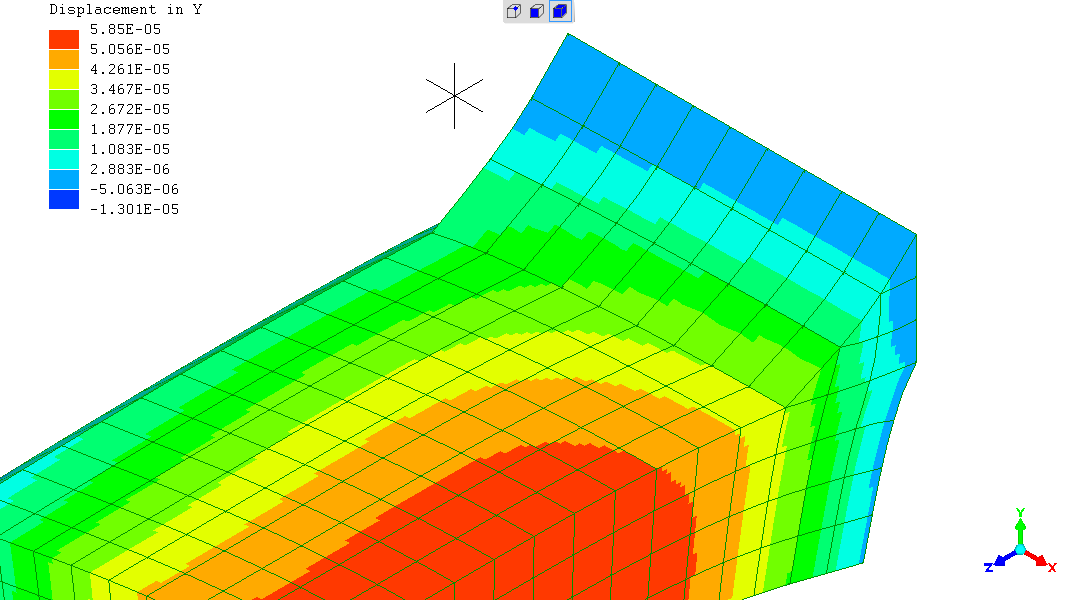
Poisson's Ratio = 0.4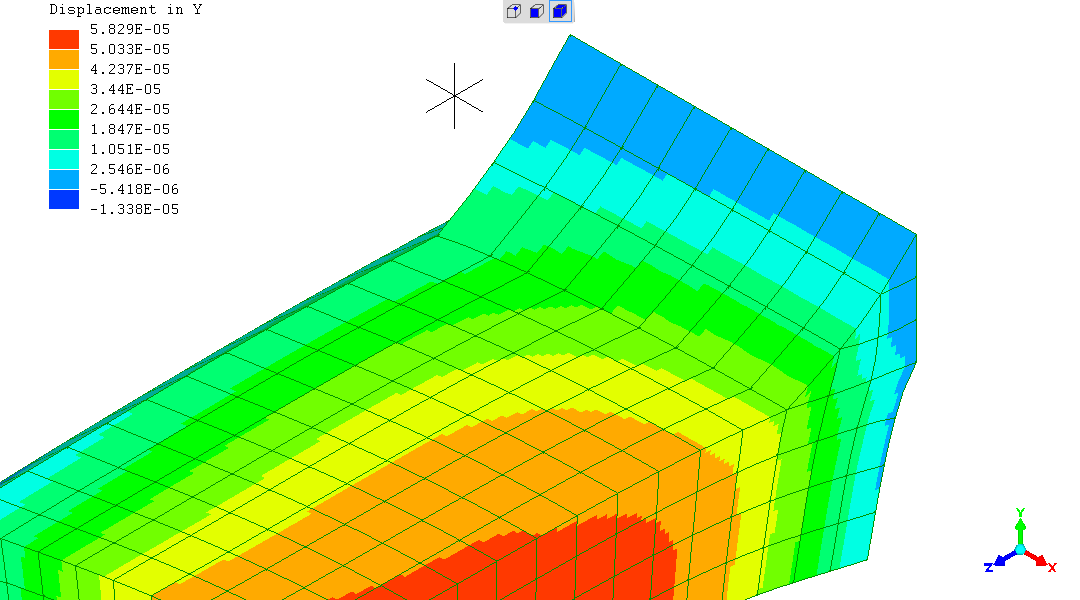
Poisson's Ratio = 0.45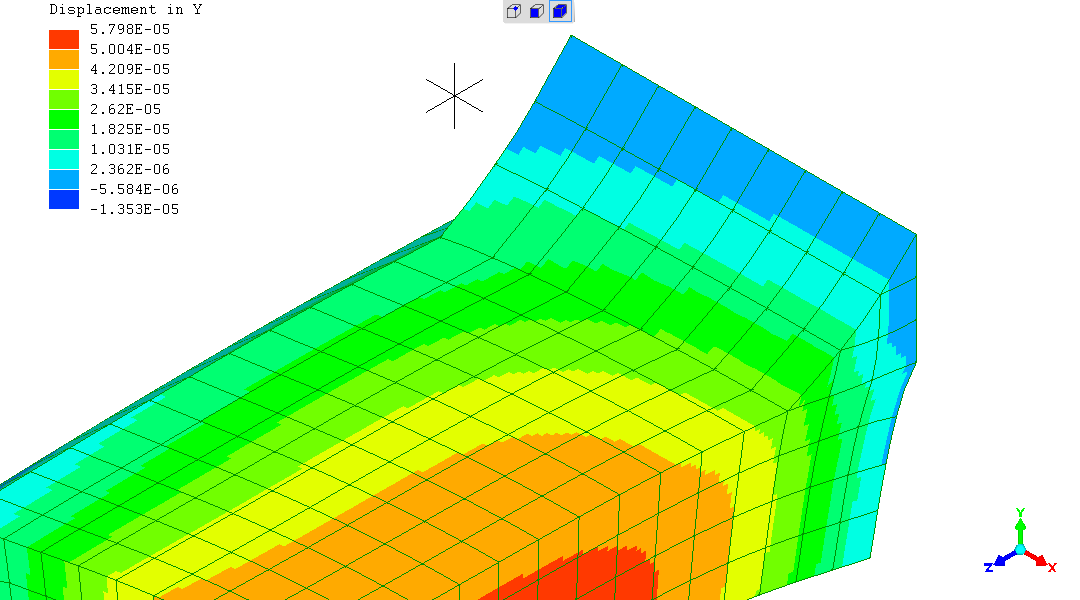
Poisson's Ratio = 0.48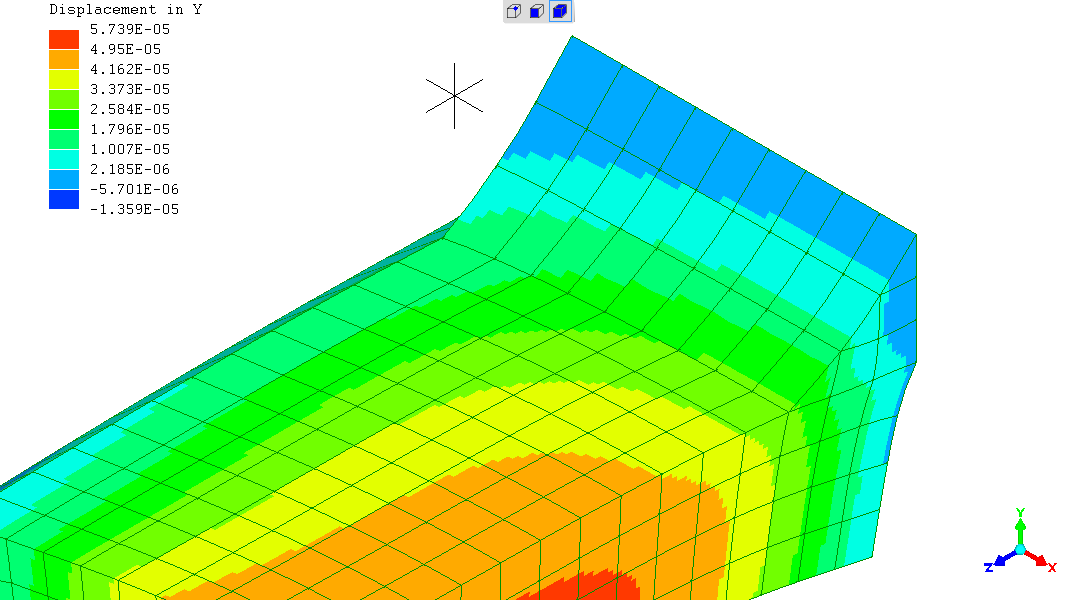
Poisson's Ratio = 0.49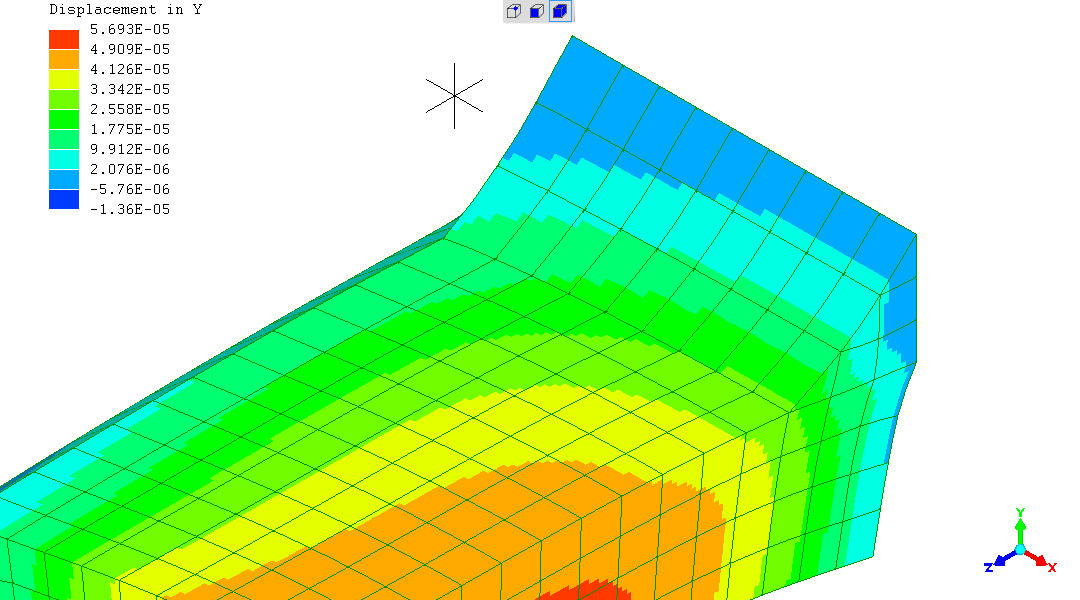
The following graph shows what appears to be an interesting story:
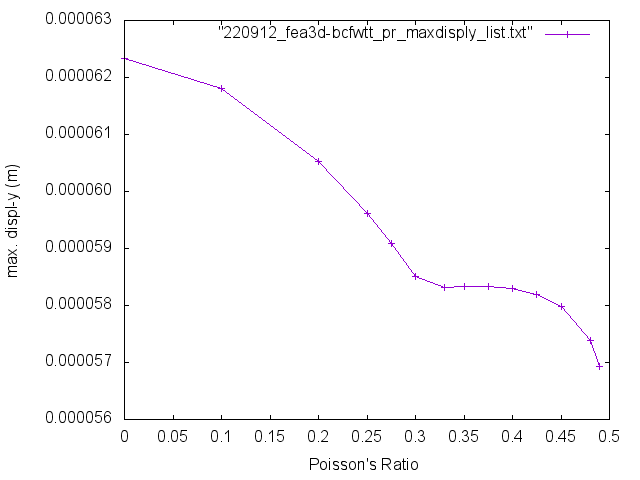
It's that almost level part between Poisson's Ratios of around 0.3 to 0.425
However, I think this is a case of
"Texas sharpshooting"
[Wikipedia link].
(you fire a magazine-full / a chamber-full of rounds at the barn wall
and draw a ring around the tightest cluster)
I perceived a pattern in the rendered "deflection in 'y'" output
images, and went looking for it. Which means there's already a
non-random influence.
I obtained more data-points for Poisson's Ratios from 0.25 to 0.425
[additional data-points : 0.25, 0.275, 0.33 (matches Aluminium), 0.35,
0.375, 0.425]
What lures non-random human intervention is that level part of
the graph happens to be over the range of Poisson's Ratios of most
engineering metals and alloys (zinc is outside that range at 0.25).
So I sought "confirmation" .
However:
So let us close on a bemused note that this beguiling observation of the graph should be roundly ignored.
Remembering the material modelled has a constant Elastic Modulus of 210GPa - matching steel - but with Poisson's Ratios specified between 0.0 and 0.49
Looking at the rendered images colourised showing the FEA output...
My own subjective judgement on looking at the images is that varying Poisson's Ratio is not having much effect - certainly not in the midranges of Poisson's Ratio between 0.2 and 0.4
Before looking at the Von Mises deviatoric stresses; the stress
concentration at the "outer" "far" end of the weld has no counterpart
in real life, as the real weld has a blended shape.
This might be seen in with the
BCFWTT test rig
webpage, and can be certainly seen with the
first BCFWTT
.
When making a Finite Element model, there almost always have to be
simplifications, either to make the model achievable with a reasonable
effort, or to economise on computing resource needed.
In this case it is a saving of effort leaving that "unreal" sharp
corner by the rounded/blended edge of the modelled Rectangular Hollow
Section. There being no cost because a stress concentration there in
the model can be ignored when evaluating the FEA predictions.
At high Poisson's Ratios just less than 0.5 (the material maintains
constant volume under stress), the stress concentrations at the
longitudinal weld leg and that weld toe do observably decrease.
Across all other Poisson's Ratios the stresses at the weld leg and in
the weld toe vary little.
For deflection in the "y" vertical direction, the deflection is a bit
higher at low Poisson's Ratio values (the material extends under
stress with little transverse contraction), but changes little in the
range from Poisson's Ratio is 0.3 to 0.48. Where most engineering
metals have a Poisson's Ratios in the range 0.3 to 0.4 (?).
So we can say the FEA simulation shows that in this case deflections
will not change much for any Poisson's Ratio met in any real metal.
In overall summary:
for the Beam-Configuration Fillet-Weld Tensile Test (BCFWTT),
linear-elastic Finite Element Analysis modelling shows negligible
effect of Poisson's Ratio on stress or deflection, for the range of
Poisson's Ratios exhibited by engineering metals and alloys.
My conjecture is that this is because the structure is thin-walled in relation to its overall dimensions, so is essentially a manifestation of plane-stress - offered tentatively.
The effect of Elastic Modulus in the range for engineering metals is
much greater than the effect of Poisson's Ratio in the range of
engineering metals.
That larger effect of the Elastic Modulus is linearly proportional in
this linear-elastic FEA model.
As seen comparing the FEA simulations of the BCFWTT for
steel
and
aluminium
(R. Smith, 07Sep2022, 08Sep2022 (40x), 12Sept2022 (graph with
observations), 13Sept2022 (texas-ss, reorder, chg.comment), 13Sept2022
(deletions, gram.))