Finite Element Analysis modelling here predicts the Stress Concentration Factor for different weld toe shapes which can result from different weld conditions.
Offering an explanation of why this focussed work...
Very technical topic of enormous significance for steel structures : I
wanted to understand the outcomes from a common metal fatigue test
type, the
"non-load-bearing T-fillet"
.
The reason for offering this explanation is so "experts" can deduce
the reason for the choices I have made.
The generality of this being a study of fillet weld toes remains.
This is about a real object subject to a load having a non-uniform distribution of stresses across it. There will be higher stress concentrations at features like corners - the Stress Concentration Factor (SCF).
So this is looking at typical real situation away from the sole (?) exception of a long uniform-cross-section object subject to a tensile force, where the stress resulting is uniform, ie SCF=1.
The presentation goes
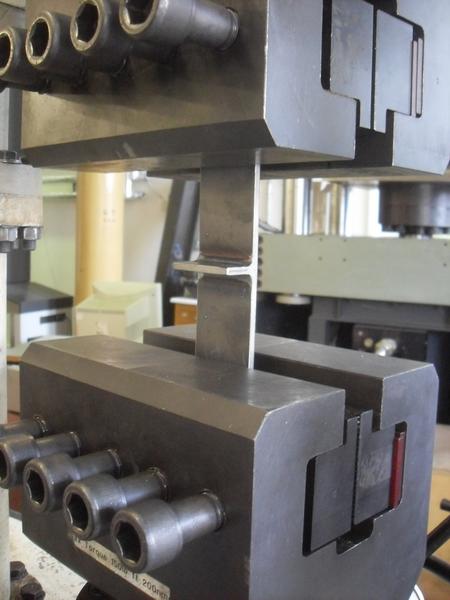
The "weld toe" is where the outer face of the weld deposit meets the metal being welded. This is general to all welds. Fillet welds are described eg on Wikipedia , where the weld toe is labelled. The form of fillet welds is well presented by The Welding Institute (UK) - which mentions weld toe but does not label it.
The modelled plate upon which the fillet weld is made is 16mm thickness. Given the model has 8mm thickness from the plane-of-symmetry.
The "side" / "terminating" plate is truncated at the "outward" weld
toe. So the far less stressed "outward" weld toe isn't modelled.
There are other simplifications.
This is a common Finite Element modelling "trick" - model just the
region which matters.
We expect and having it confirmed by observations in real life that
the weld toe at the load-bearing longitudinal plate is the highly
stressed one which matters. The one modelled here.
The material properties of steel have been represented in the model: 200GPa Young's (elastic) modulus and Poisson's Ratio of 0.3.
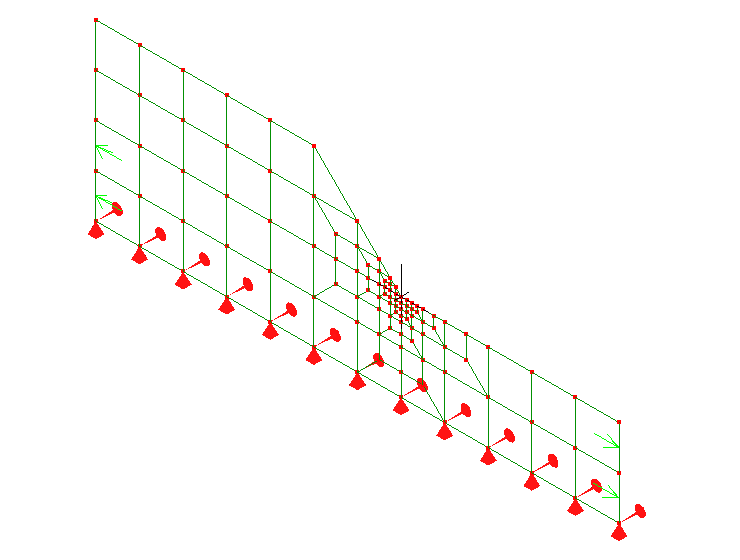
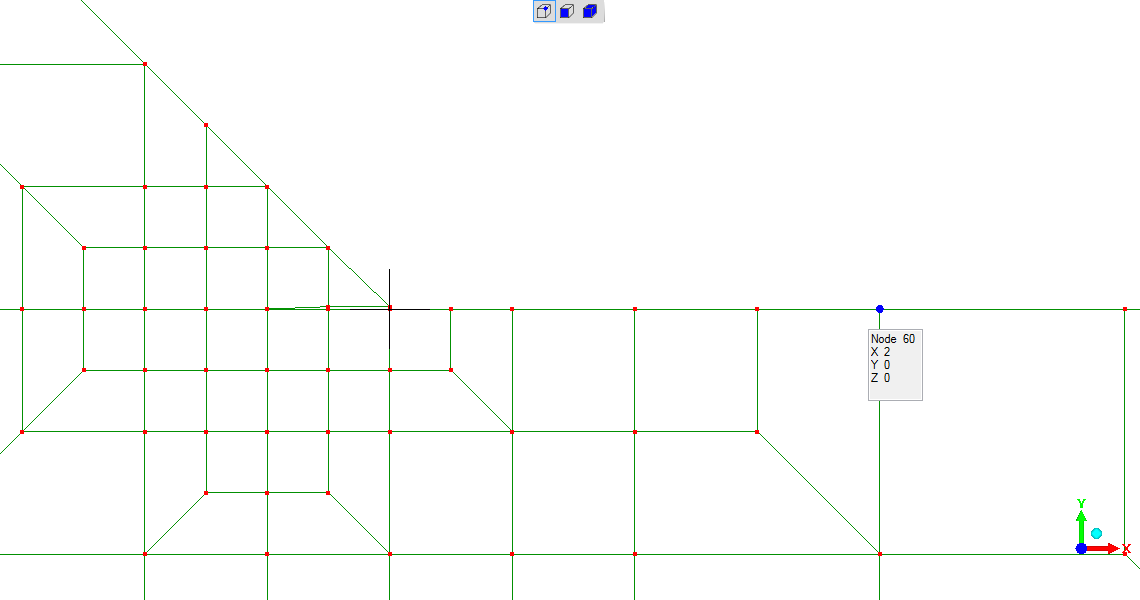
Seen as manually meshed. "Refine x2" used repeatedly when chasing convergence.
The mesh shown in isometric view is for the "blueprint" case. The "trumpets" (no rotation) and "plinths" (no up-or-down movement) enforce the plane-of-symmetry as if this were a "cruciform" rather than a single-sided "T" fillet.
The mesh shown in elevation view is this same mesh.
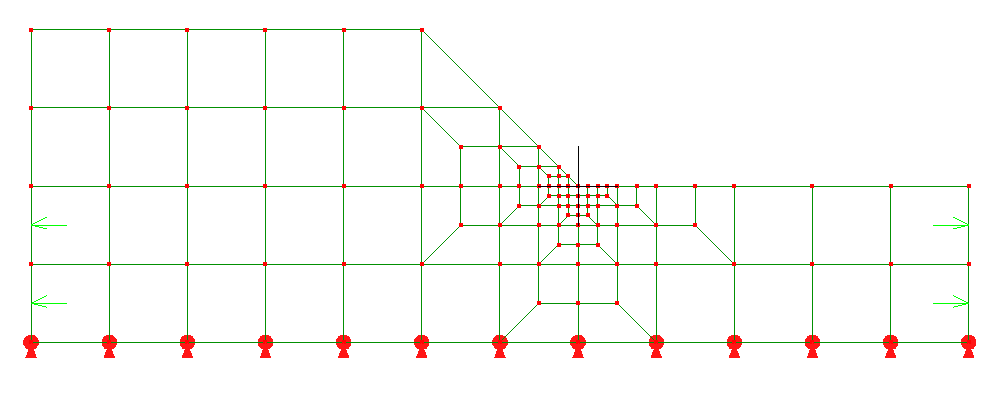
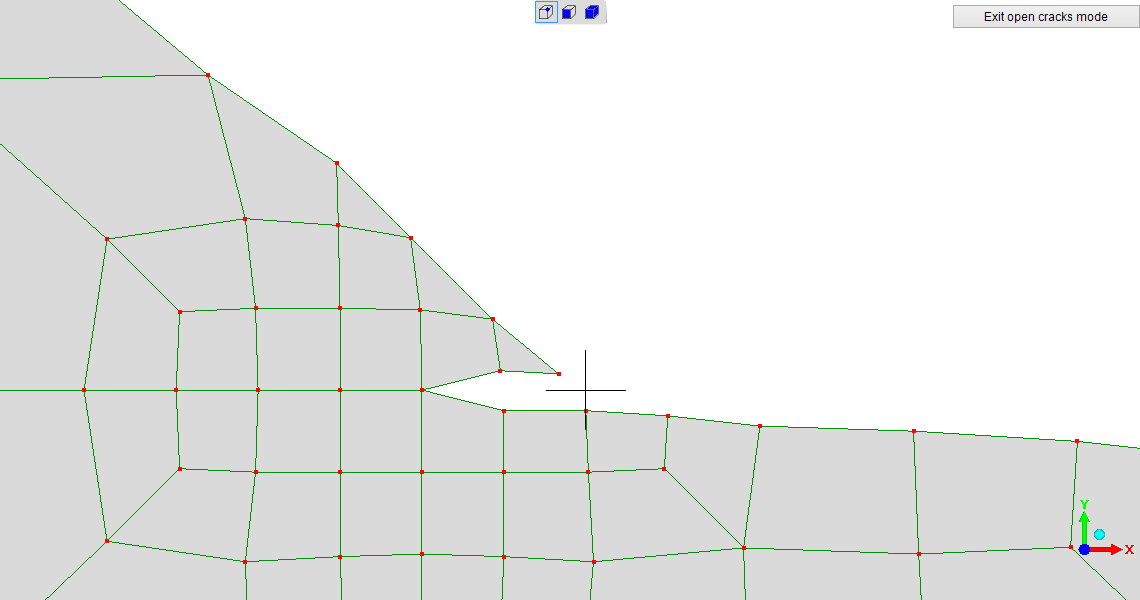
For the other two cases, the overall mesh is the same. There is local mesh modification to represent "toe intrusion" and "toe-groove".
Show here is only the local region around the weld toe.
As if the weld had a perfect 45degree mitre and a flawless intersection with the plate metal being welded.
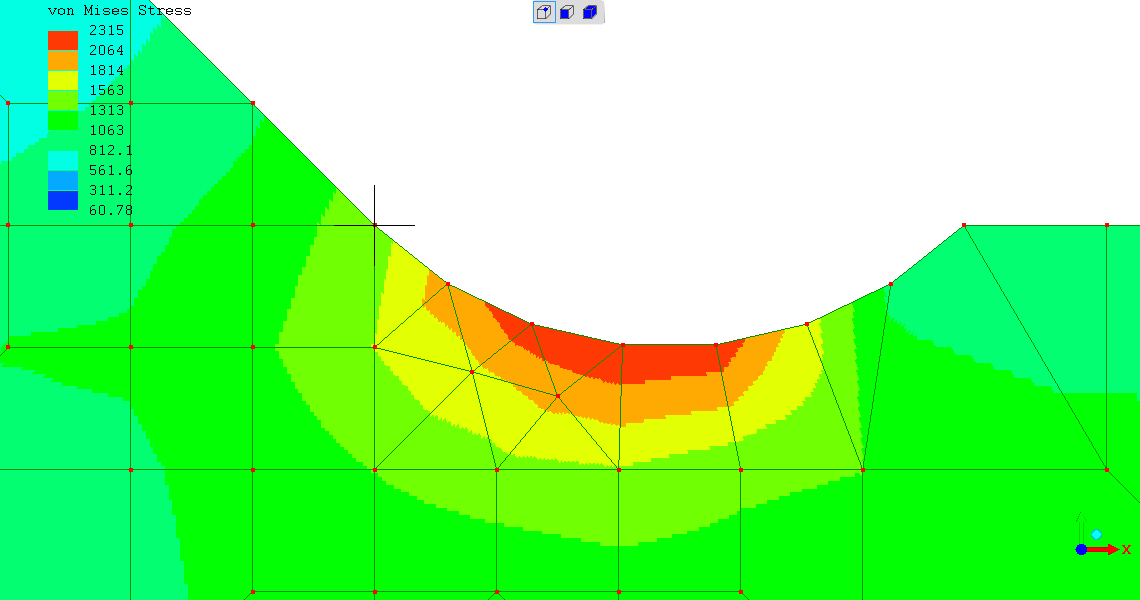
The toe-intrusion is modelled as a 0.5mm long sharp-tipped crack, intruding along the plane of the surface of the plate, at the weld toe.
Better revealed in "crack opening mode" display.
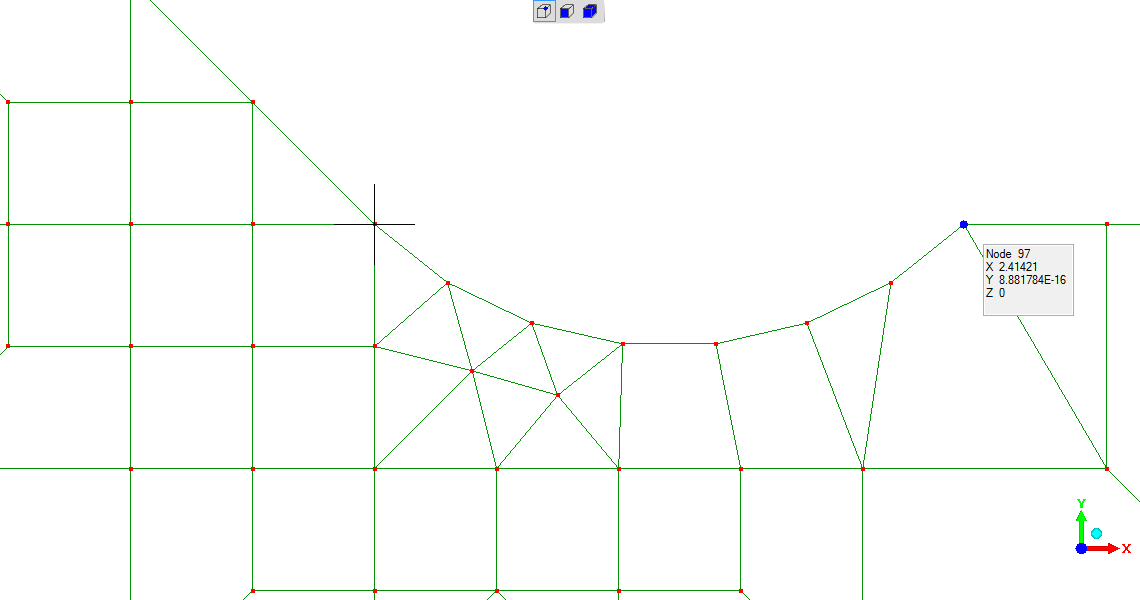
Toe-groove is modelled as being 0.5mm deep. Transitioning into the weld bevel at the 45degree bevel angle, this results in a toe-groove which is 2.4mm wide.
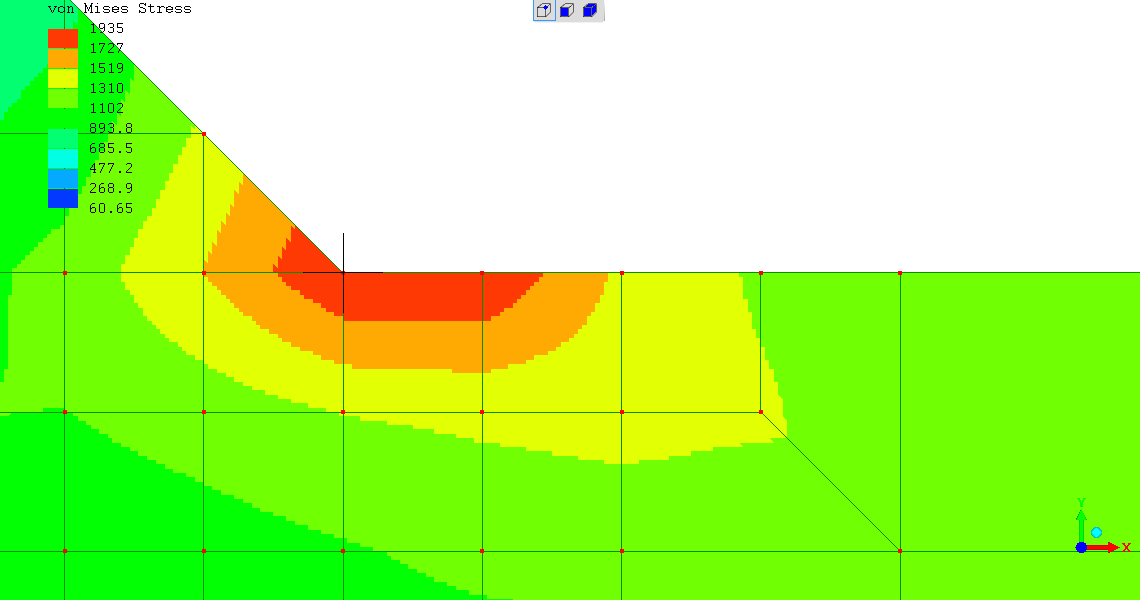
The results shown in these stress-as-colour renderings are approximate and qualitative. The discretisation isn't fine enough, so just see the overall pattern of stress and don't compare between models.
I've set the force to give a uniform stress of 1000 were the SCF=1.
But as I've said, see the overall pattern of stress flows in each
model, but don't compare between models or seek fine details within
the models as seen here.

The outcome is conveyed in entirety by the following graph:
(also
presented here
in PDF format)
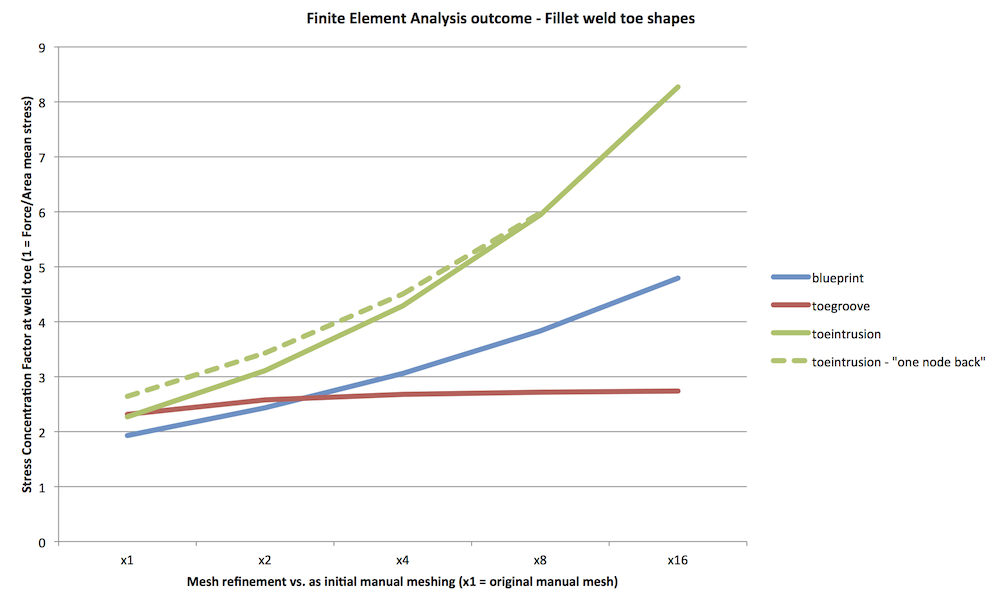
Explaining the graph lines as follows:
In an ideal world, all the lines would be horizontal: the predicted
stress concentration factor would always have a single constant value.
However, Finite Element Analysis is an approximate method. The
predicted answer(s) will more closely match the actual answer(s) as
discretisation / mesh-refinement increases. That's "convergence".
However, some models won't "converge". They "diverge".
Even the "wide" 135deg angle of the fillet weld toe of the "blueprint" case defies convergence, with ever-rising stress-concentration with increasing discretisation / mesh-refinement.
The "toe intrusion" case, which is effectively a crack, has the
steepest upward slope, representing the most rapid divergence with
increasing mesh refinement. As expected for a crack the predicted
peak stress rapidly becomes larger with mesh refinement.
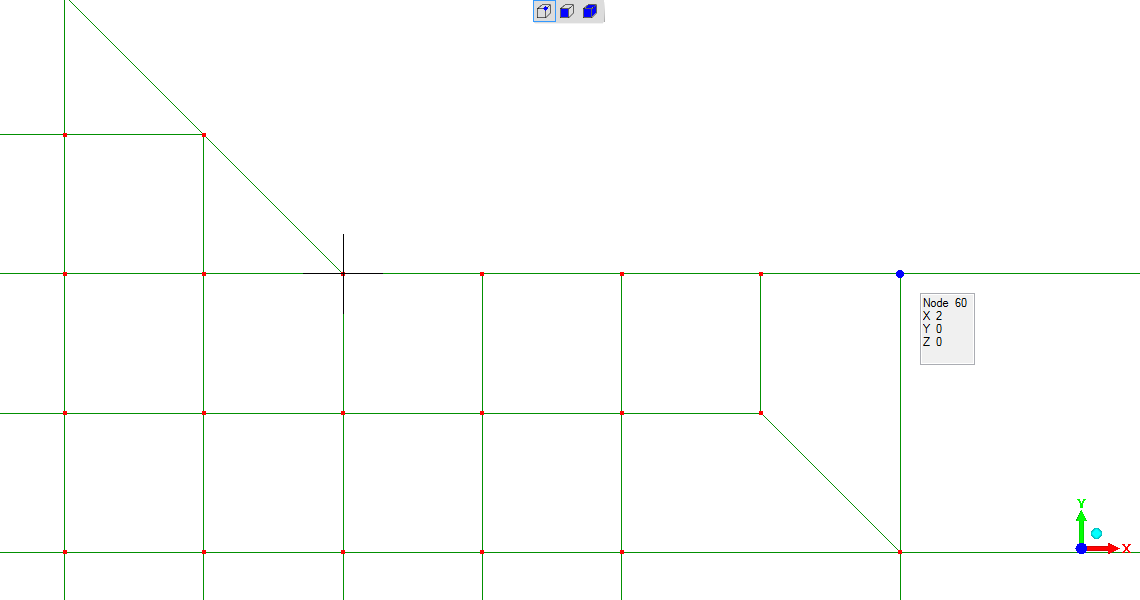
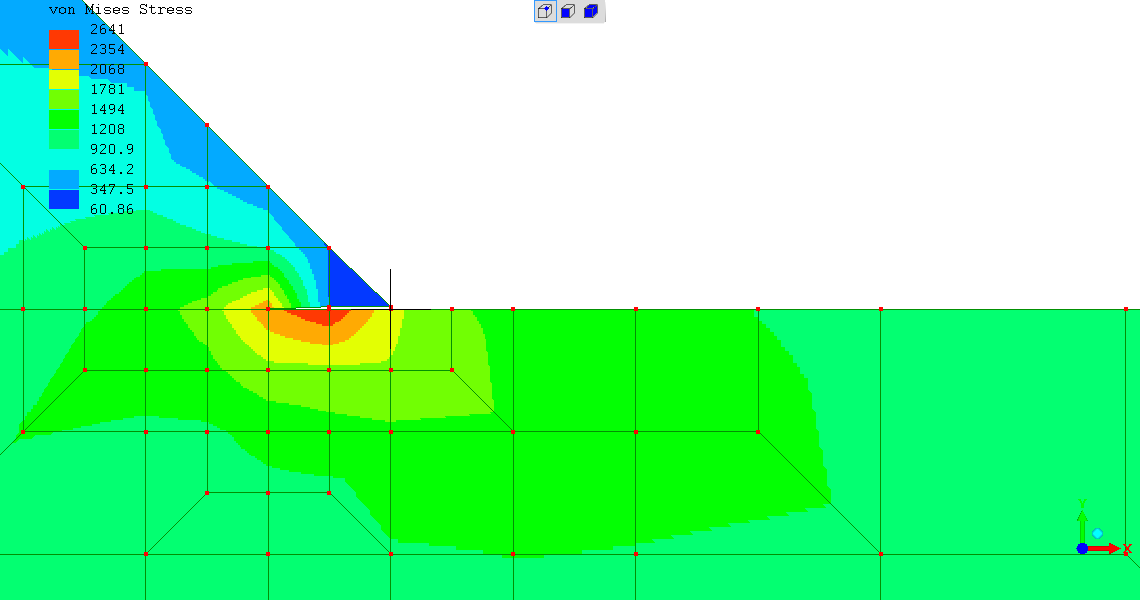
The dashed second line for this case shows a physically incorrect
output of the finite element analysis model - where highest stress is
not at the crack tip (physically it definitely is!), but back from the
crack tip on the plate (not weld) side.
This is shown in eg the coarse manual-meshed
model of stresses around fillet weld toe-intrusion
.
As discretisation / mesh-refinement increases, the maximum stress
predicted does move to the crack tip - hence the termination of the
dashed line. At least this is physically correct...
The "toe groove" case does converge.
It settles to a value of 2.7 stress-intensification factor with
increasing mesh refinement.
Established engineering knowledge suggests this is reasonable. The
peak stress concentration around any cylindrical ("drilled") hole in a
large plate in tension along its length is x3.
(search on "stress intensity factor hole plate" eg
[external link]
image and analytical derivation)
The "toe groove" case agrees with a physical reality. Borderline
toe-groove and modest toe-groove are associated with excellent
fatigue-resistance.
The only plausible explanation is that the stress concentration factor
(stress intensification factor) at the weld toe must be lower than for
"preferred" (sic) welds.
(Previous efforts - R. Smith, 17May2016, 14Aug2017, 31Aug2017, 21Sep2017)
(Current page - R. Smith, 17Feb2022, 19Feb2022 (intro.))