
For this objective, here is sufficient knowledge of
metal fatigue
[Wikipedia].
Only the overall nature of fatigue and its characteristics are
needed here - the Introduction,
Stages of fatigue
and
Characteristics of fatigue
Significant in the following explanation will be these two topics from
section "Stages of fatigue";
Crack initiation
and
Crack growth
.
No overall treatment given. Sufficient details and basis to discuss...
Overall form of a weld :
"Parts of a Weld"
[Lincoln Electric]
Note the two weld toes in both main types of weld, which are central
to the following discussion.
The American Welding Society definition [
>
] of Weld Toe is "The junction of the weld face and the base
metal."
SCF == Stress Concentration Factor, and is "the crux of matter".
My approach here is dismissive of previous treatment of fatigue design.
For a "perfect" length of any material in uniaxial tension, Stress=Force/Area, which is uniform across the cross section. That SCF=1. That is unattainable in general welding. Moving on...
Welds should have an SCF of around 3.
This aligns with the SCF of a smooth hole in infinite plate being
SCF=3.
This is well-known in engineering - original derivation
cited
as being E.G.Kirsch in 1897. That article providing the familiar
illustration of the effect.
Finite Element Analysis modelling of a "good" weld (blended weld toe
cross-sectional shape) concurs.
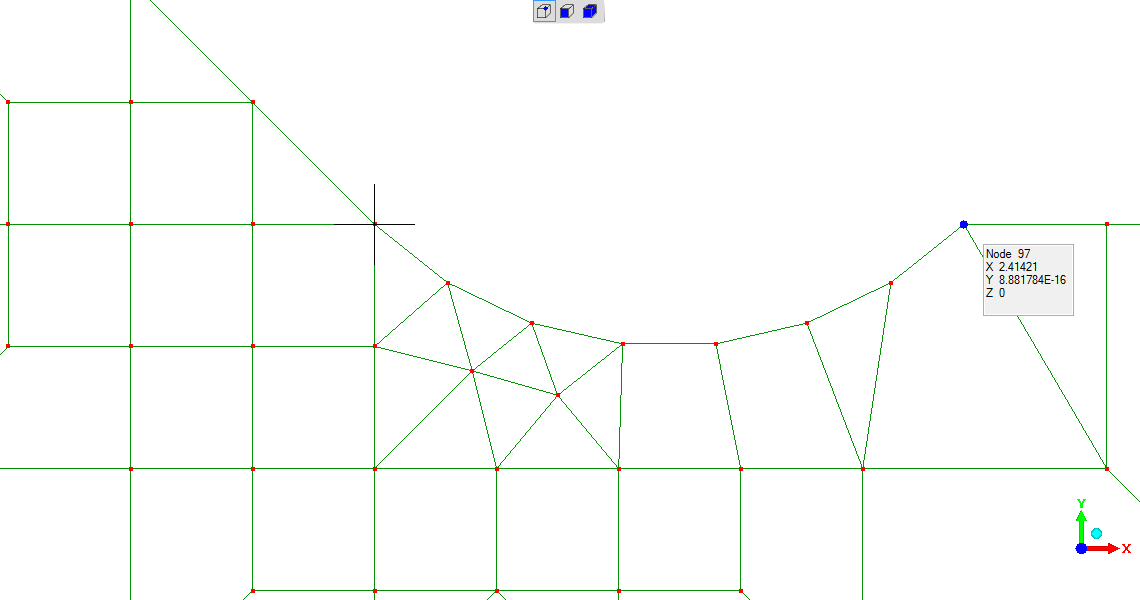
(Model before mesh refinement),
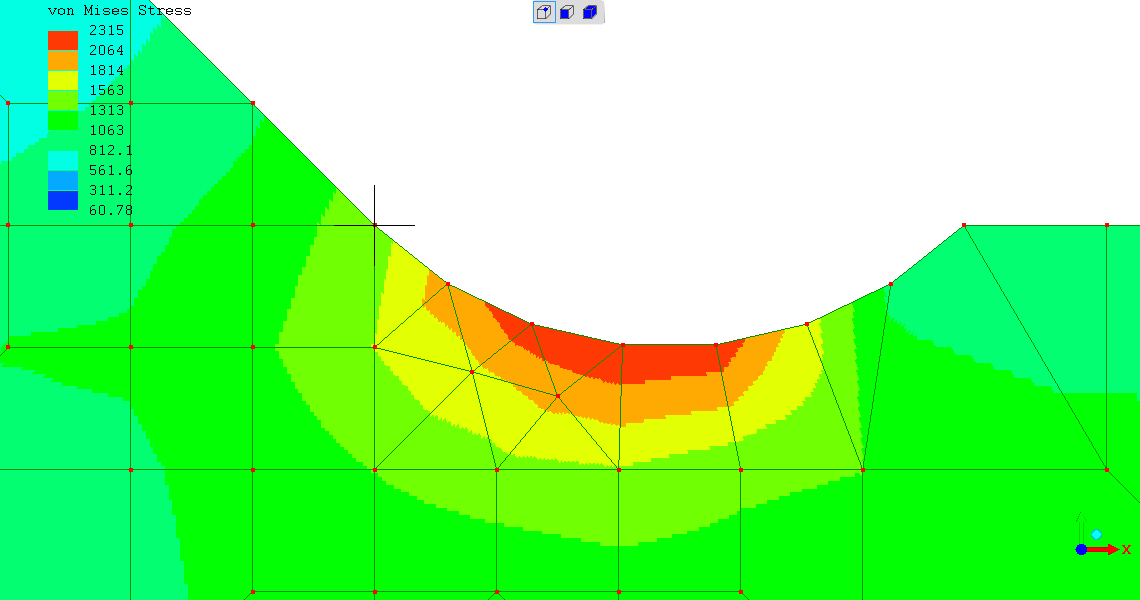
(very approximate stress result before mesh refinement)
with result (see the red-brown "toegroove" line) converging at SCF~=2.7
You cannot easily beat "SCF = 3", as the steel will have its own flaws likely to be around 3 in the best of circumstances.
SCF~=3 == SCF is approximately equal to 3; it is around 3
The "to this strategy" outcome is arrowed with the "!!"
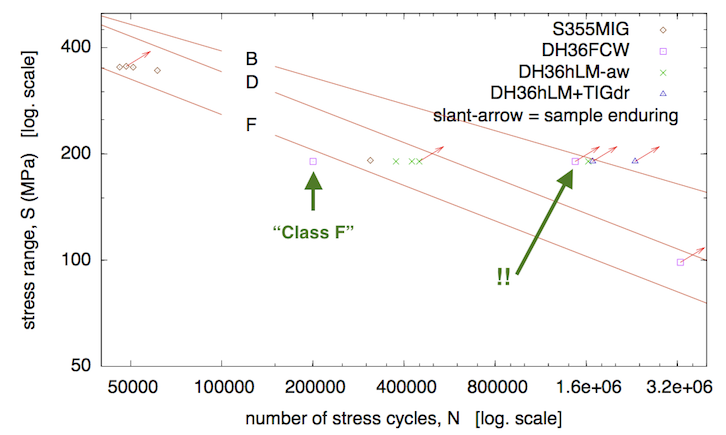
Note both scales are logarithmic. That's 5.9X current expected endurance to break, unbroken.
That is along at the fatigue performance of the steel plate itself -
the "Class B" line.
ie the weld and the steel being joined have about the same
fatigue endurance.
Which is what you'd expect, implementing the strategy explained.
The historic performance of welded structure in fatigue loading (cyclic loading), made according to current orthodoxies, is much lower. Perfectly illustrated in the "S-N curve" image just shown. The otherwise identical but to current Welding Procedure Specification weld labeled "Class F" broke at exactly the expected fatigue endurance according to current orthodoxies.
[Note : consider only the "S355MIG" and "DH36FCW" "commercial weld" points - the other points are commercially infeasible exotic trial welds]
This is the performance associated with all current Standards on welds (listed without explanation - ISO15614; ISO9606; ISO5817 & ISO 6520) and fatigue design (also without explanation - the EN1993 "Euronorms").
Why?
The elegant explanation continues the "Stress Concentration Factor" approach.
These historic SCF's >> 3 (are much greater than 3). Acting at the weld toes, previously noted as being where attention is to be directed.
Earlier, in previously seen image for a new-style "good" weld
is a curvaceous blended weld toe with an SCF~=2.7
Welds to current orthodoxies have the "dreaded" toe intrusions, with
very high SCF - example
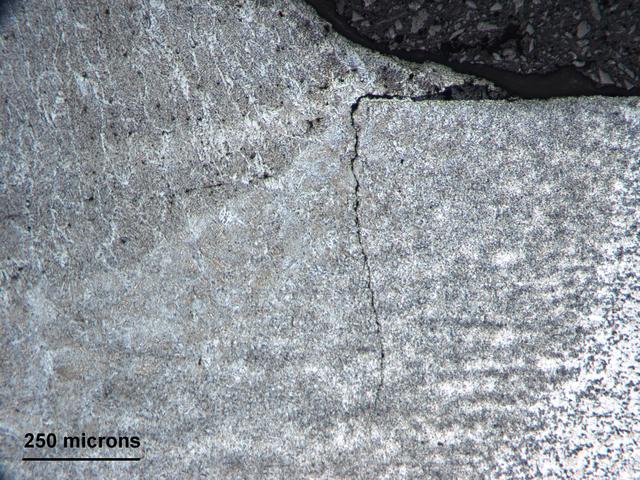
The horizontal toe-intrusion is about 0.25mm length. These tiny
crack-like features at the weld toes, with a very high Stress
Concentration Factor, do most of the harm.
An early-stage fatigue crack is the vertical feature from its inner
tip...
That SCF cannot be analysed by Finite Element Analysis modelling (?),
as the model is "divergent" on mesh refining chasing an answer.
Already to be seen in
FEA results
- the green "toeintrusion" line.
Analytical treatments are subjects like Fracture Mechanics.
Most explanation can be constructed from the "Stages of fatigue"; Crack initiation and Crack growth .
| crack initiation stage | crack growth stage | |
|---|---|---|
| toe intrusions | no | yes |
| blended toes | yes | yes |
The duration of the crack initiation stage can be much longer than the duration of the crack growth stage. So for there to be an extensive fatigue crack initiation stage is highly advantageous to structural performance in cyclic loading.
Furthermore, crucial to the following arguments:
The very high SCF from toe-intrusions results in immediate crack growth, with no crack initiation stage.
This is axiomatic in current weld fatigue orthodoxy, including Standards.
Consequences:
The only conceivable (?) explanation for the "to this strategy" / "SCF~=3" outcome ("!!"), recently presented as the S-N curve image, is that a fatigue crack initiation stage has been created.
Evidence supporting the suggestion : that sample has done 5.9X the
conventional entire endurance to fatigue fracture with no detectable
fatigue crack yet
(detecting >=0.5mm crack; true detection ability not better known).
If a fatigue crack initiation stage has been introduced, the consequences:
The caution around "potential" is that favourable tendencies could be defeated by other factors.
Were fatigue endurance to become a favourable function of yield stress, the commercially valuable consequence would be advantage in using high-strength steels in cyclically loaded structures like bridges.
(R. Smith, 04Jul2021, 05Jul2021 (ref Intro, S1, S2))