For me : two-objectives exercise
Outcome...
Notes:
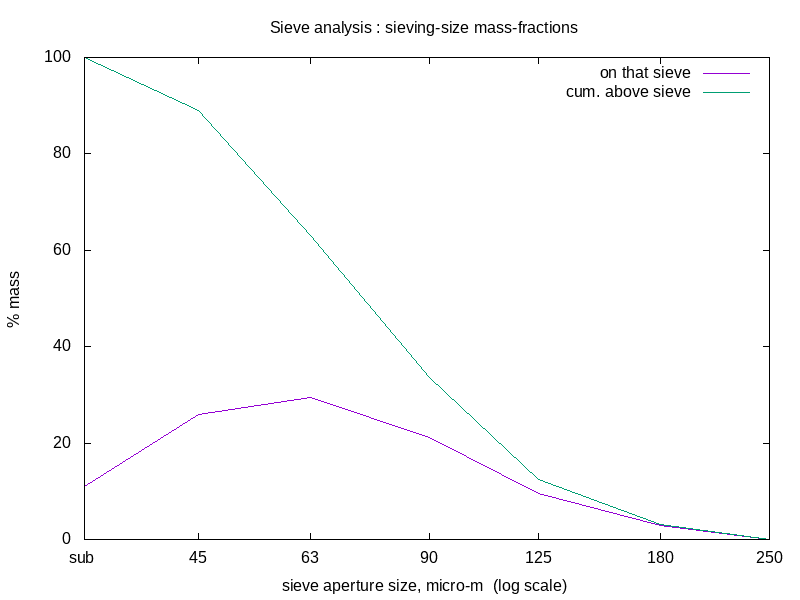
I plotted the example data in Barry Wills' "Mineral Processing Technology" book - the tabular data of Table4.3 in Chapter 4.
Quoted as:
size_range	nom	mass(g)
+250....	250	0.02
-250to+180	180	1.32
-180to+125	125	4.23
-125to+90	90	9.44
-90to+63	63	13.10
-63to+45	45	11.56
-45.....	0	4.87
Proved to be a good exercise.
Hope to use sieve analysis and have own data to process, in refining
my/our mineral processing endeavours here in Cornwall.
"groundwork" done...
(R. Smith, 26Jun2025)