I had tide data from the
British Oceanographic Data Centre
for March 1967 for another purpose.
This very simple comparison offered itself of the hourly profile of
tidal seawater heights for the three locations of Dover, Newlyn and
Milford Haven.
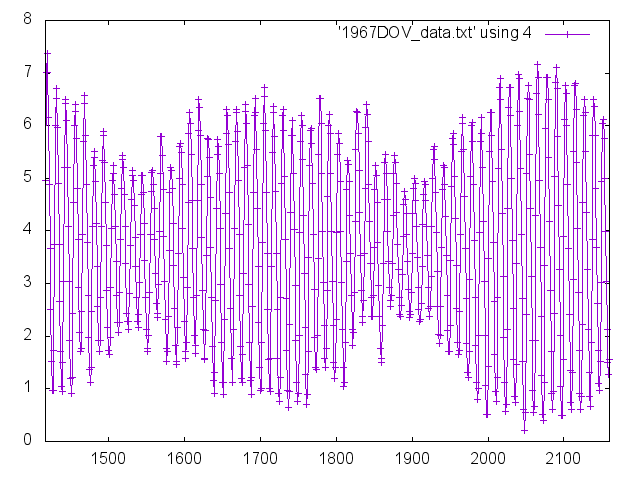
Dover:
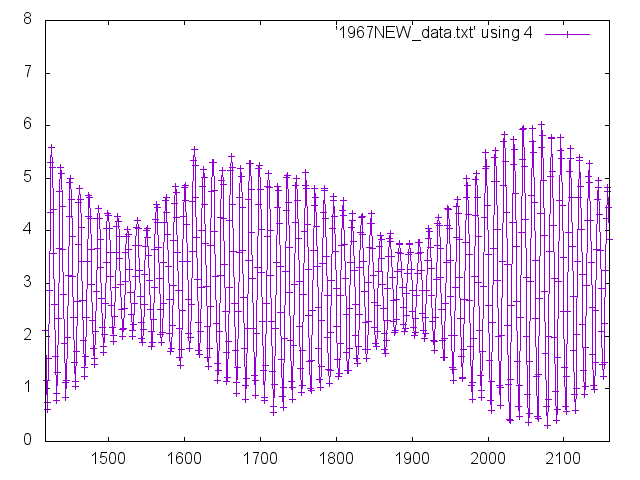
Newlyn:
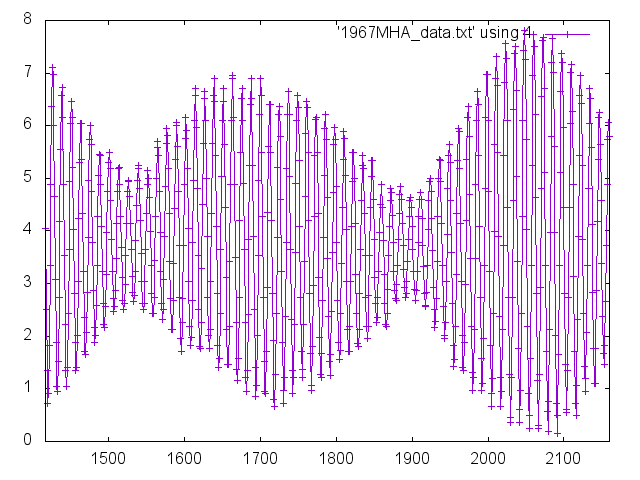
Milford Haven:
All three locations show the two-week cycle of Neaps<=>Springs in-step - as expected.
Newlyn, home of the famous tide Newlyn gauge, has the smallest tidal range and the outer-envelope profile of the highest and lowest tides is notably smooth.
Milford Haven is seen to have a larger tidal range by something like a metre, while its outer-envelope profile of the highest and lowest tides is also smooth.
Dover has a tide range which looks intermediate between those of
Newlyn and Milford Haven - but the outer profile of the highest tides
and of the lowest tides is irregular / "ragged".
That is not the most fortunate characteristic for a "reference port"
regarding tides.
I'm not equipped to explain all this.
It is just a simple opportunity which happened to presented itself to
me to obtain these graphs.
This is comparing like-with-like from around 55 years ago. Seawater levels are seen to be rising and that would offer a good project to someone; to compare historic data at various intervals and current data. Which for sure scientists (oceanographers?) are doing.
(R. Smith, 28Jul2022)