 The "Triton AMV4000F" weld-monitor
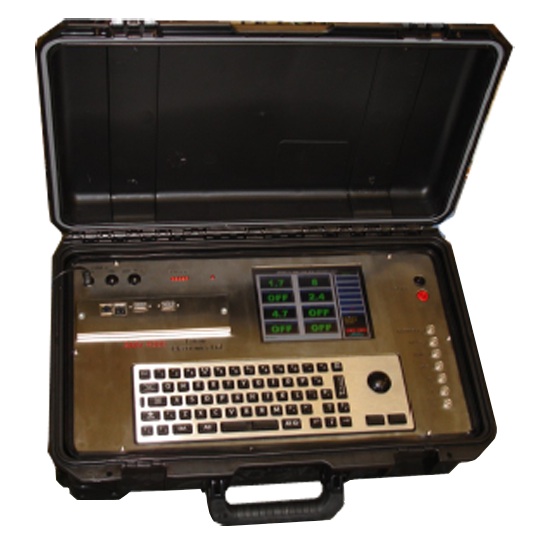
Photo of the device as published by its manufacturer:
The "Triton AMV4000F" weld-monitor
The electrical conditions in welding can be a bit harsh with wild "interferences", to which a weld-monitor is "hardened" against being easily damaged. Therefore, its function here in gathering and making available a raw high-sample-rate data table was hugely appreciated.
A "weld monitor" is intended to be used to show that a welder (the person) stayed within required conditions during the course of making a weld - a commercial industrial and construction-site application.
The leads and sensors are connected to the welding power unit and between the welding power unit and the workpiece via the weld-monitor. The machine automatically logs the conditions - typically Amps, Volts and wire-feed-speed (for a MIG/GMAW type welding process).
The weld-monitor has an easy-to-use operator interface through which it could be instructed to collect the data at the chosen rate when the weld was running.
The data-table was extracted from the weld-monitor on a memory-device and post-processed on unix ("Linux") computer, using the standard "unix toolkit"; especially "awk" the "pipelining" ("on-the-fly") mathematical-processing tool.
The "GnuPlot" graphing tool took
the post-processed data-file and plotted the graphs seen for the
various welding processes, as seen in the section of the website of
which this page is a part.
(This author makes the point that "GnuPlot" also graphs mathematical
equations and is commended for that use)
(R. Smith, 28Jan2016)